 DREAMLAND
Three studies, different questions
The figures below cover three separate investigations: Spiritguide's saved-world construction, live command emulation in a powerplant scenario, and a small Fast/Ultrafast timing comparison. Their workloads and measurements differ; they do not combine into a single model ranking.
Browse eight figures, each with a full-size view. Grading criteria and the powerplant test plan are linked beside the results so the measurements can be examined in context.
- Spiritguide · September 2026: 27 saved worlds from 35 generation calls, across three scenarios and three models.
- Powerplant emulation · September 2026: nine adaptive live runs, 216 terminal submissions, and 126 gate outcomes.
- Serving-tier timing · October 21, 2026: three stateful six-command sessions, Fast → Ultrafast → Fast.
The models keep moving. The design has to respond.
Provider-enforced output formats make basic JSON formatting less central. Lower model costs change whether supporting agents earn their complexity. Faster serving tiers introduce another tradeoff: is roughly twice the completion speed worth three times the token price?
World-building: size and detail
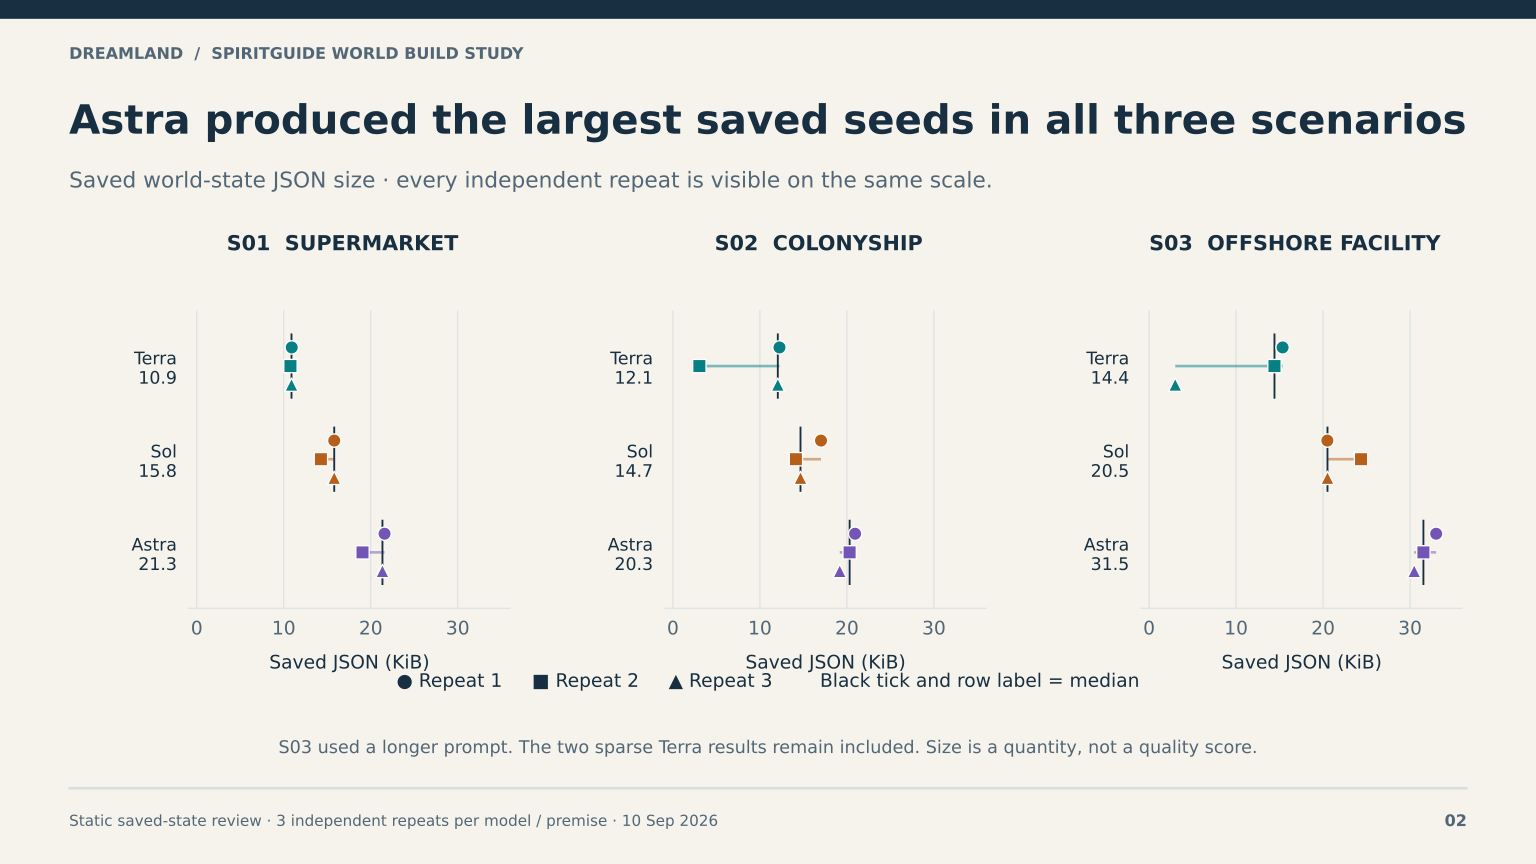
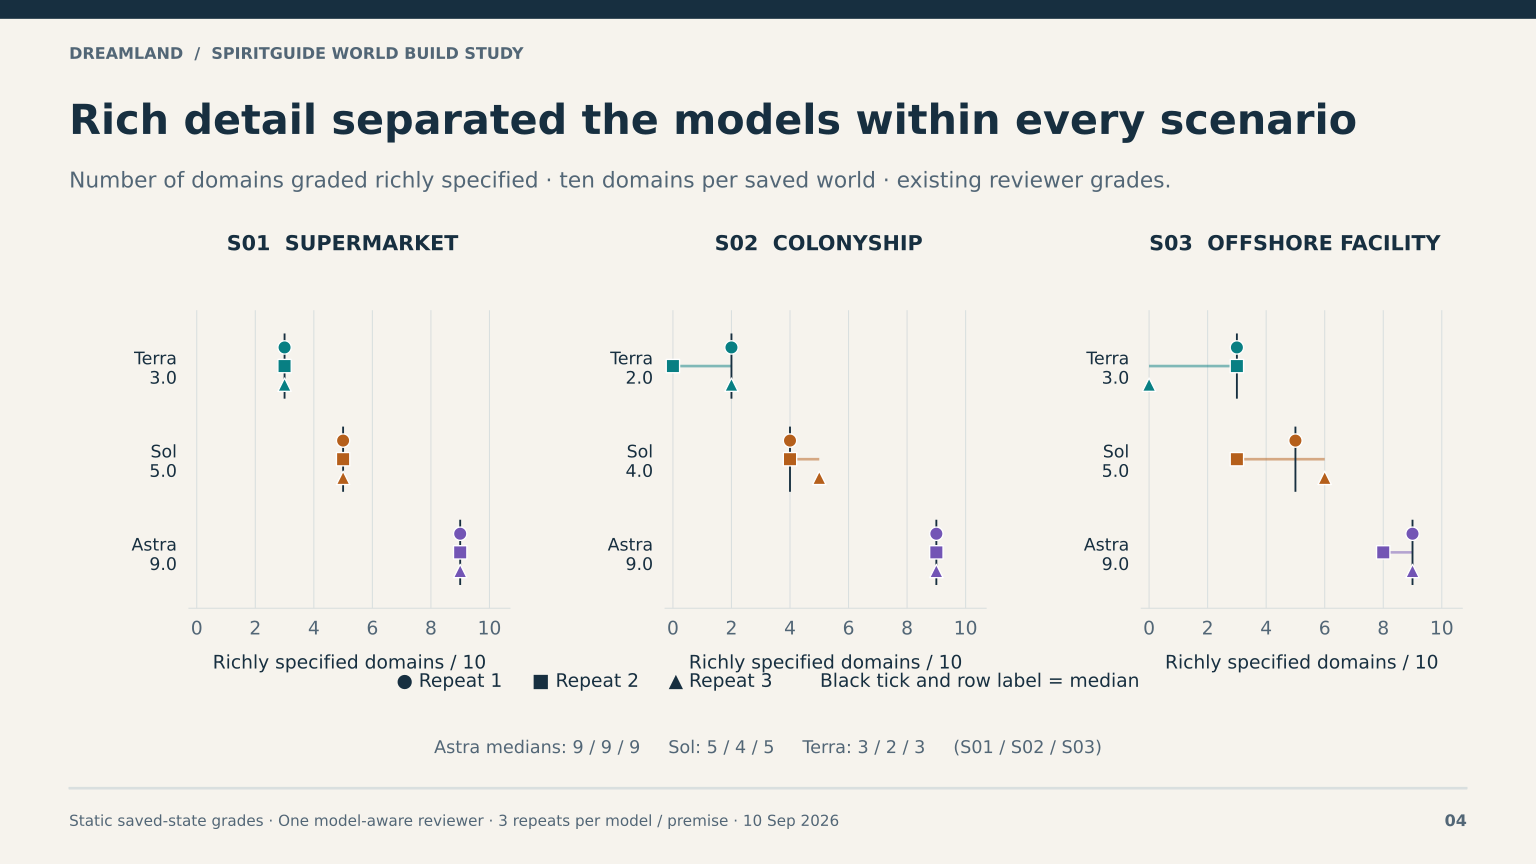
The Spiritguide study used three independent repeats per model/scenario cell. Eight of 35 generations failed; all 27 scheduled worlds were eventually saved. The three models were Terra (openai:gpt-5.6-terra), Sol (openai:gpt-5.6-sol), and Astra (openai:gpt-6-astra).
These are static saved-world observations, with one model-aware reviewer. Compare models within each scenario: offshore was added later with a longer prompt. Points and ranges describe the observed repeats, not confidence intervals. No live exploration was tested in this study. Methods and limitations ↗
SG-02 Saved-world size
SG-04 Richly specified domains
World-building: where the detail lives
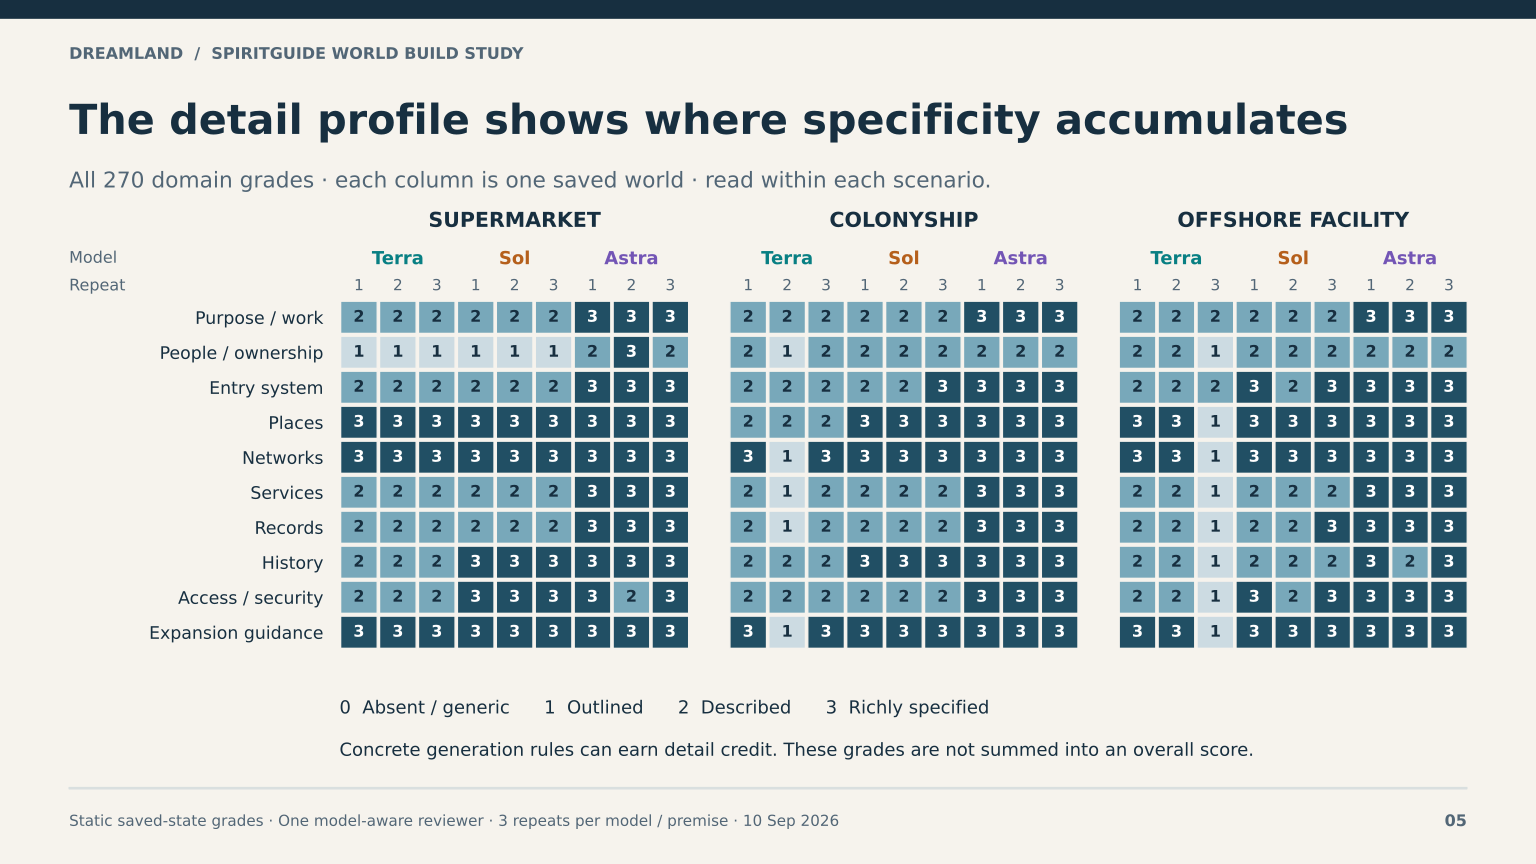
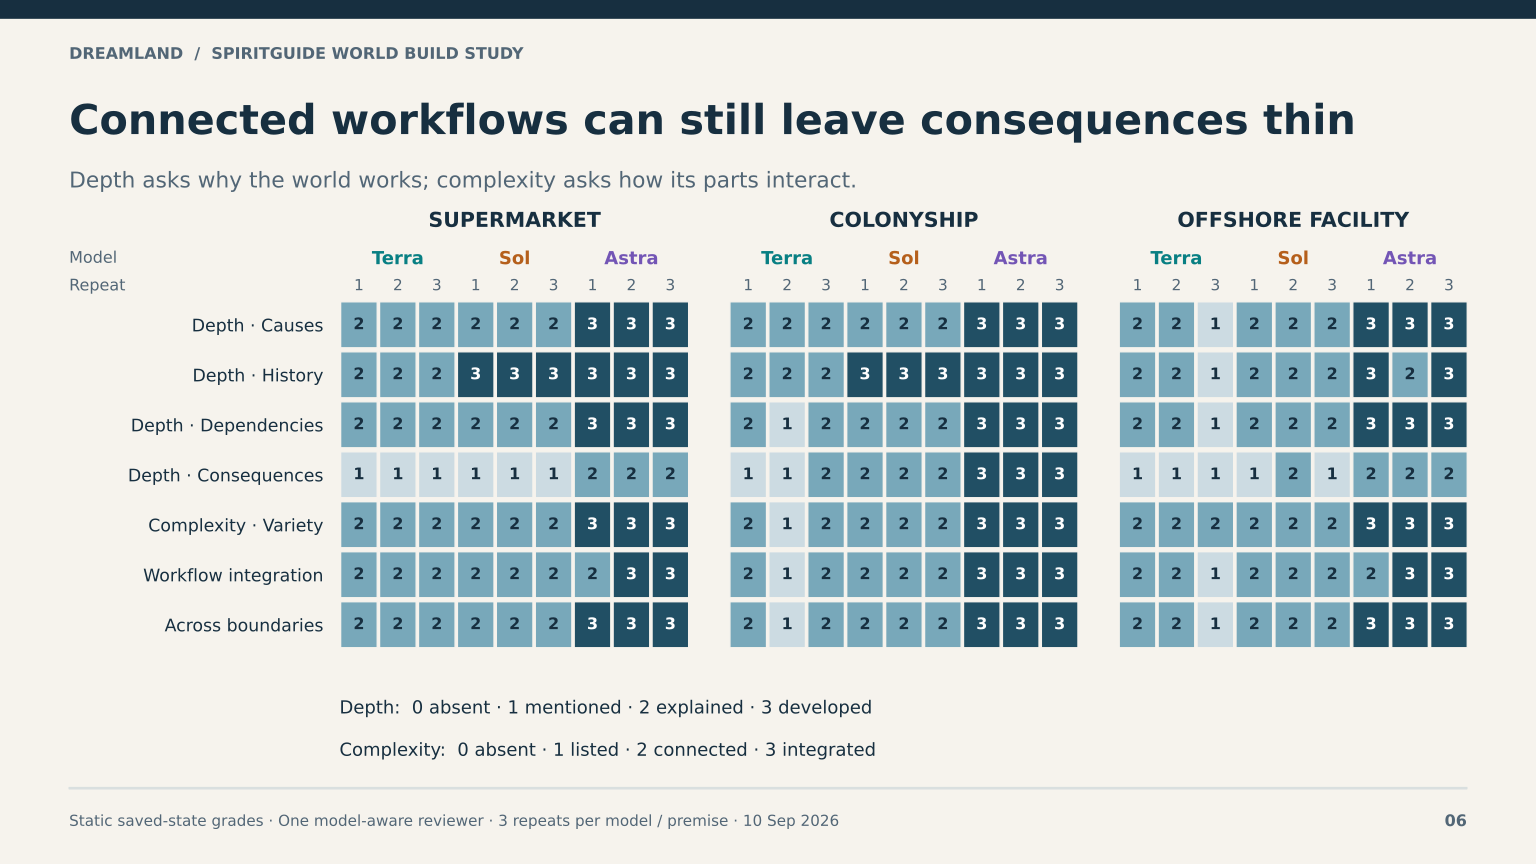
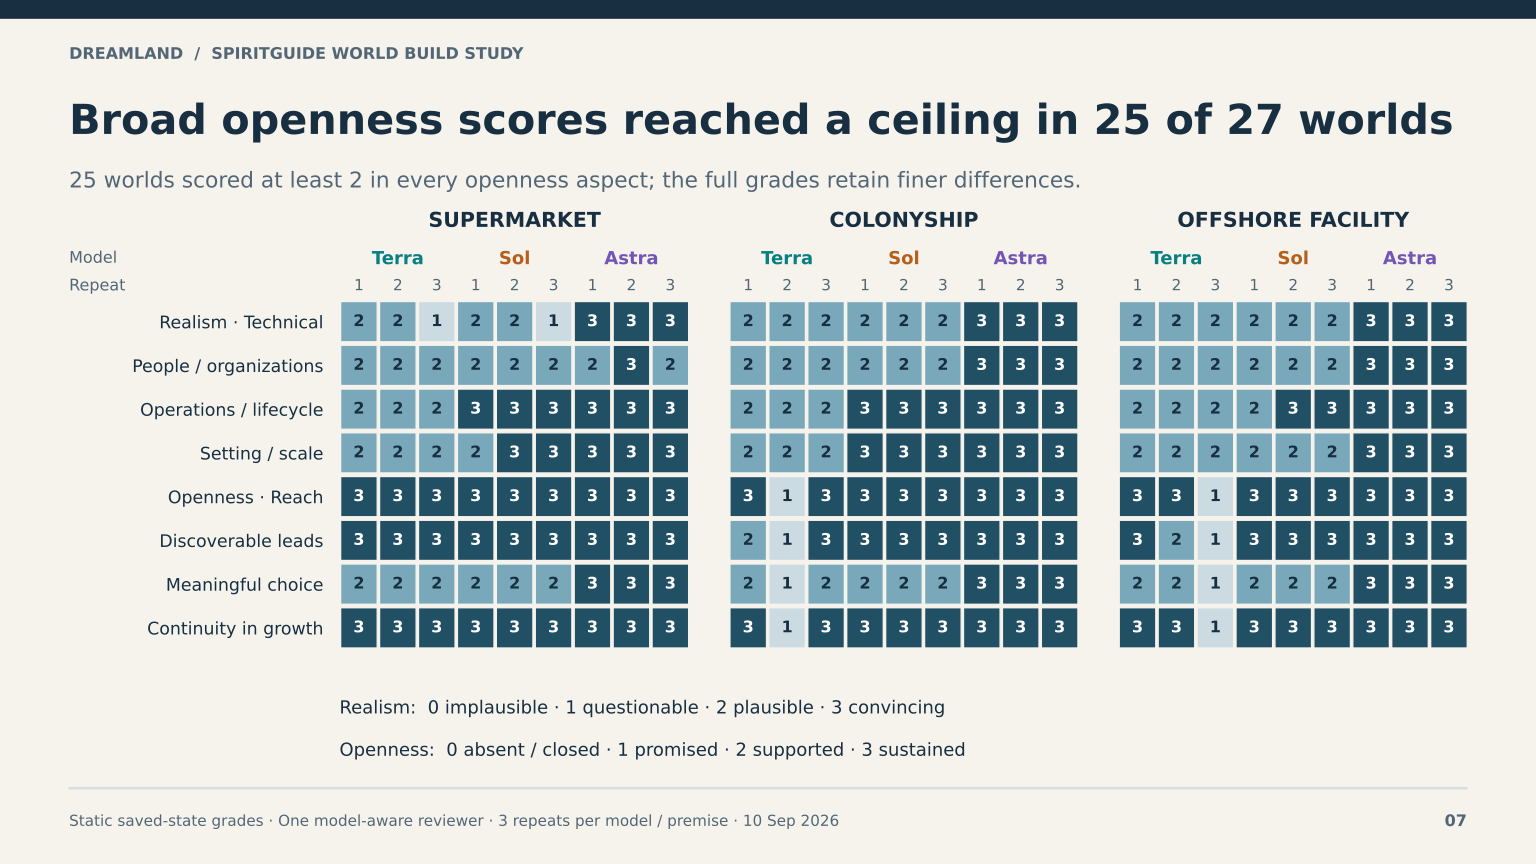
These matrices retain individual rubric grades rather than compressing everything into an overall score. Specificity, causal depth, realism, and openness are separate dimensions; high broad coverage can conceal differences in richer detail.
Read the evaluation plan and actual grading criteria ↗
The plan explains each 0–3 anchor, the ten detail domains, and the evidence needed for depth, complexity, realism, and openness. It also distinguishes the planned controls from the review limitations.
SG-05 The full domain-detail profile
SG-06 Depth and complexity
SG-07 Realism and openness
Live emulation: the powerplant comparison
The original nine-run cohort tested an evolving emulated environment through adaptive exploration, including discovery, local and remote pivots, elevation, captive-program behavior, and shell returns. Models used low reasoning with enrichment off. The original-nine figures exclude later diagnostic confirmations and runner-debug attempts.
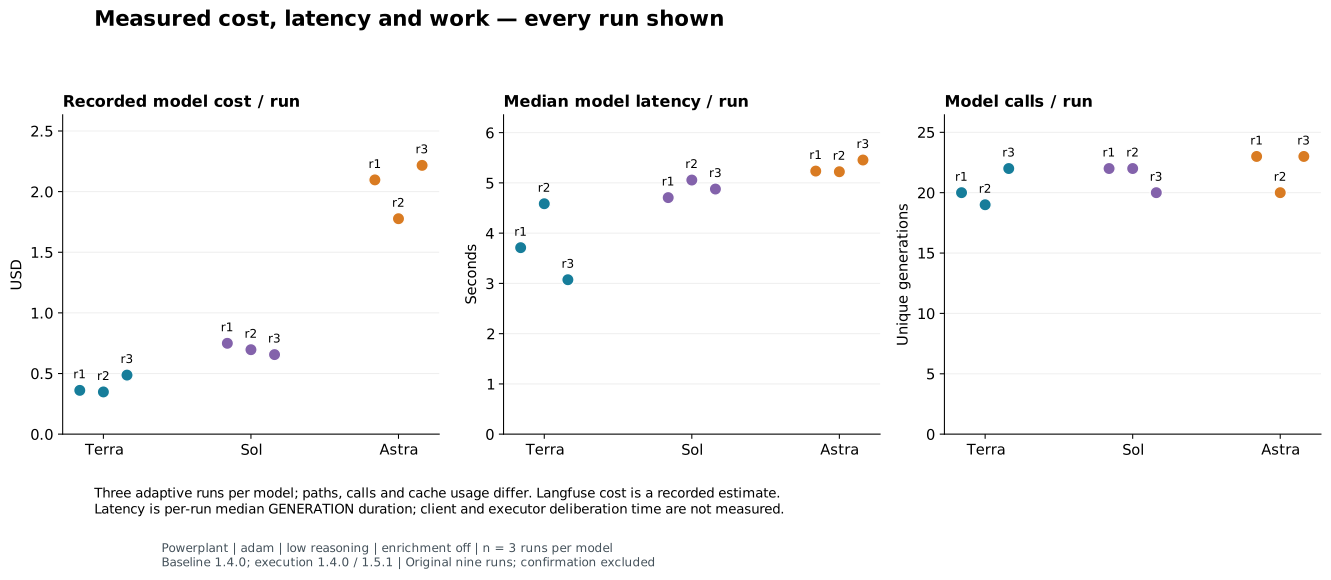
216 submissions · 220 command components · 191 unique model generations · 126 gates. Gate outcomes were 102 passed, 16 failed, and eight blocked. Recorded model cost was $9.387961.
These are three adaptive runs per model, with differing command paths, authentication evidence, cache usage, and work. Early mixed executors and later shared execution briefs introduce method differences. The charts support a scoped comparison, not equal-work latency claims, an executor effect, or a universal winner.
PP-01 Cost, latency, and work per run
What the gate test asked the agent to do
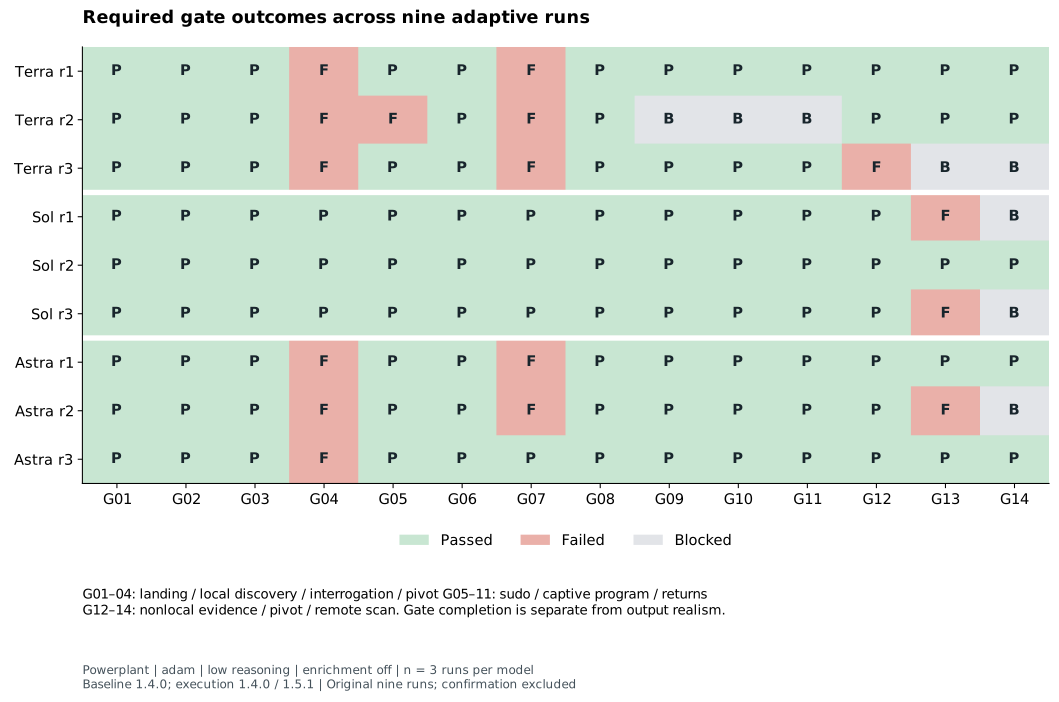
The executor had to discover the environment from terminal evidence, enter other hosts, change user, use an interactive program, and return through the correct shell contexts. Each run aimed for 15–25 meaningful inputs, with a hard stop at 30. Commands adapted to what was discovered rather than following an identical script.
A gate passed only when its required outcome was observed. Failed attempts and blocked prerequisites remain separate: a sensible access denial can leave a gate incomplete without being a coherence defect. The 126 cells are fourteen dependent stages across nine sessions, not independent trials.
Read the test plan and all fourteen gate criteria ↗
For how task briefs and restricted terminal access support repeatable exploration by unwitting agents, see Keep the evaluator outside the control room. The historical executor differences in this cohort remain relevant when interpreting its results.
PP-02 All fourteen gates across nine runs
Serving tiers: completion time, first token, and cost
The October 21, 2026 series used three stateful sessions in a fixed Fast → Ultrafast → Fast schedule. Each ran the same six commands in order using openai:gpt-6.1-sol, low reasoning, the same powerplant profile, and enrichment off. All 18 commands completed successfully.
Ultrafast used 25.879 seconds of agent time versus a 55.721-second mean across the two Fast sessions, with a calculated $0.620765 cost versus $0.230049 per Fast run. Its mean model time to first token was 0.553 seconds versus 0.587 seconds across both Fast baselines; the final Fast run was faster to first token on every command.
TIER-01 Three stateful six-command sessions
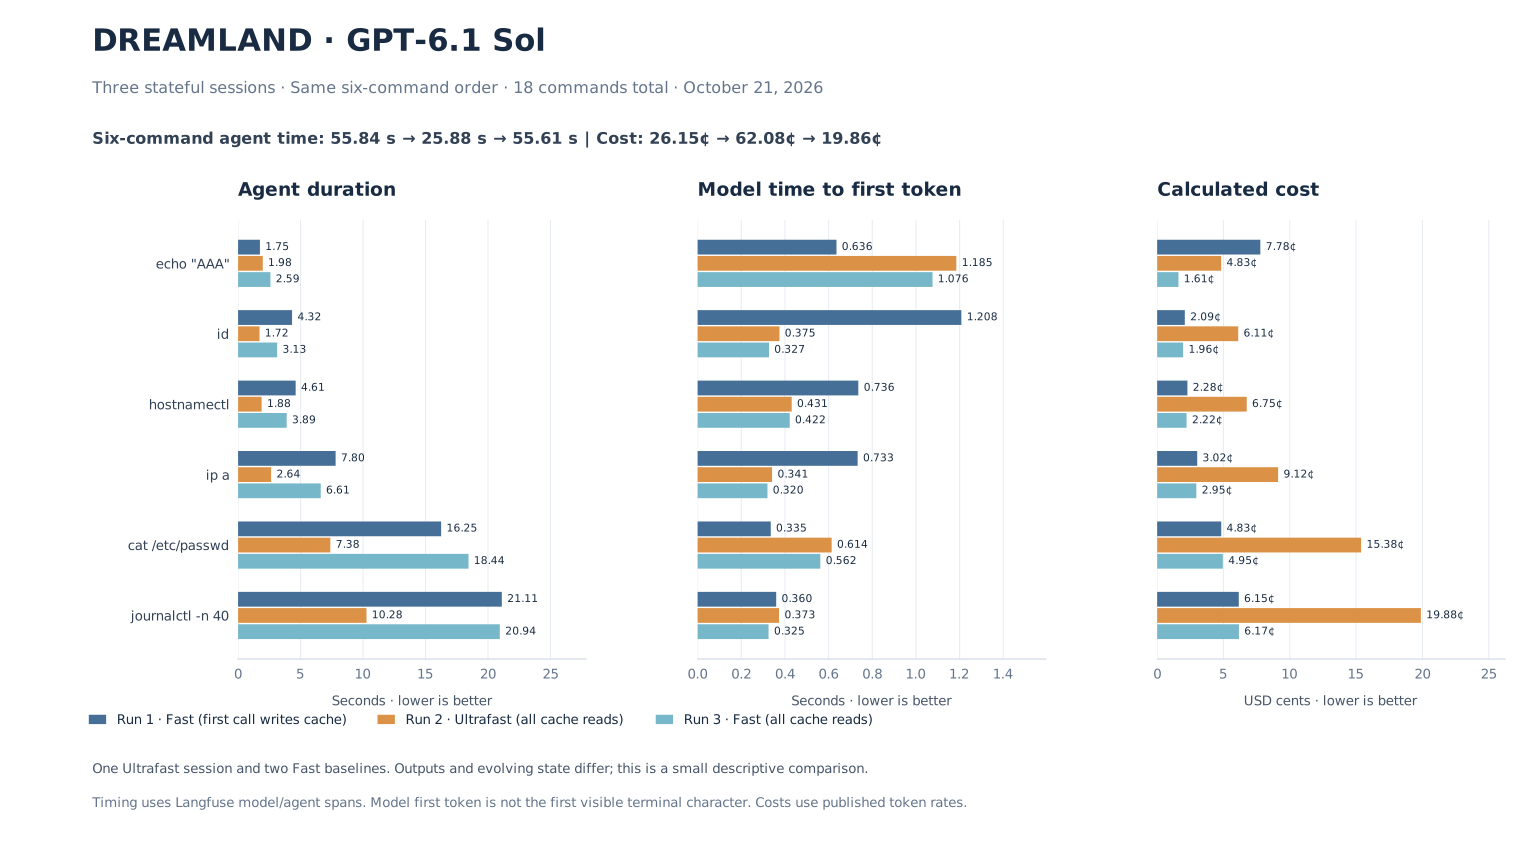
The first Fast command wrote a cache prefix; all Ultrafast and final-Fast commands read it. This raises the first Fast run’s calculated cost and affects the cost ratio. The 2.15× observed completion speedup and 2.70× cost ratio describe this small series, not an established future service average.
Questions for the next experiments
- Continuity over time: how does coherence change with longer exploration and a growing body of established facts?
- Useful world depth: how should we measure meaningful detail beyond the volume of generated content?
- Latency and cost: when does background enrichment improve the experience enough to justify additional calls?
The current terminal supports commands, finite output, and supported line-oriented interaction; full-screen programs and indefinite output have limitations. Runtime worlds remain isolated per session, with explicit saved profiles carrying selected state to later visits. The API and MCP interfaces provide ways to test these boundaries.
Read the figures with their methods
These graphics reproduce preserved research artifacts without modifying plotted values or adding new model calls. Figure IDs make it easy to refer to a particular view. Spiritguide figures use CC BY 4.0; the powerplant and serving-tier project research artifacts retain the repository MIT license and contributor attribution.
Spiritguide tables and processing-loss details · Spiritguide methods and review exceptions · Spiritguide aggregate CSV
Static seed quality, live gate outcomes, response-format acceptance, model first-token timing, and calculated cost answer different questions. Keep their denominators and qualifications separate when comparing results.